  |
|
|
|
|
|
|
| |
|
|
|
|
|
|

What
do you think?
|
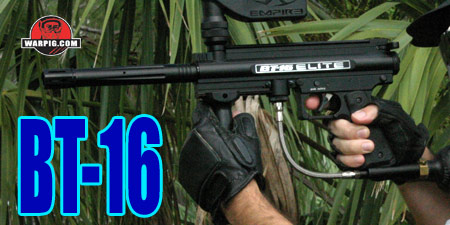
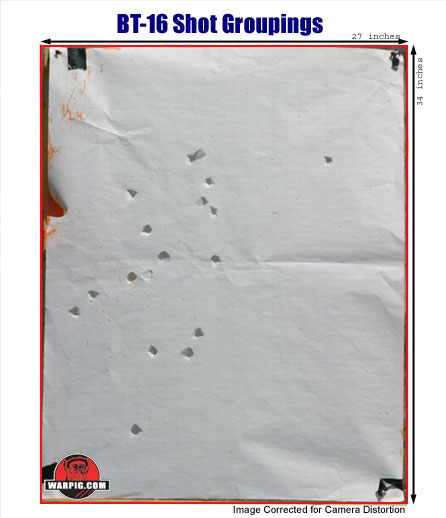
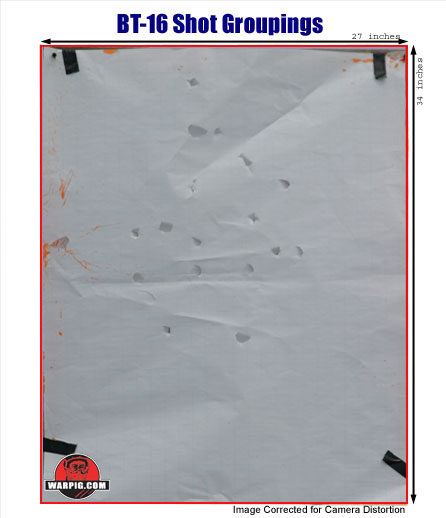
BT-16 Elite By Bill Mills - Photos By Dawn Mills - Sept 2005 Overview - How it Works - Disassembly - Testing - Raw Test Data Raw Test Data Velocity comparison between 1bps and
12 bps.
ROF Velocity Consistency
Understanding the Summary Data High: This represents the highest velocity in the recorded string of shots. Low: This represents the lowest velocity in the recorded string of shots. E.S.: Extreme Spread - this is the difference in velocity between the highest velocity shot and the lowest velocity shot. Ave: Average - this is the average velocity of the string of shots. This is the number to look at to compare whether velocity is increased overall, or decreased overall by a change in a variable. S.D.: Standard Deviation - S.D. Is a mathematicall way of expressing how close most of the shots are to the average. The lower the Standard Deviation is, the more consistent the velocity is. 95%: This is an easier to understand
way of expressing consistency. Statistically, there is a 95% chance
than a given shot will vary this amount or less from the average.
Target Groupings:
|
| Copyright © 1992-2019
Corinthian Media Services. WARPIG's webmasters can be reached through our feedback form. All articles and images are copyrighted and may not be redistributed without the written permission of their original creators and Corinthian Media Services. The WARPIG paintball page is a collection of information and pointers to sources from around the internet and other locations. As such, Corinthian Media Services makes no claims to the trustworthiness or reliability of said information. The information contained in, and referenced by WARPIG, should not be used as a substitute for safety information from trained professionals in the paintball industry. |