  |
|
|
|
|
|
|
| |
|
|
|
|
|
|

Product Testing performed with DraXxus Paintballs
What
do you think?
|
Stryker STR-1 Features HowItWorks Disassembly Adjustment Testing Data RAW DATA WARPIG Ballistic Labs Test Results
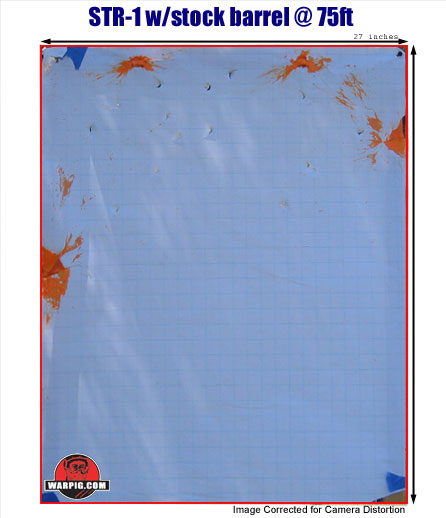
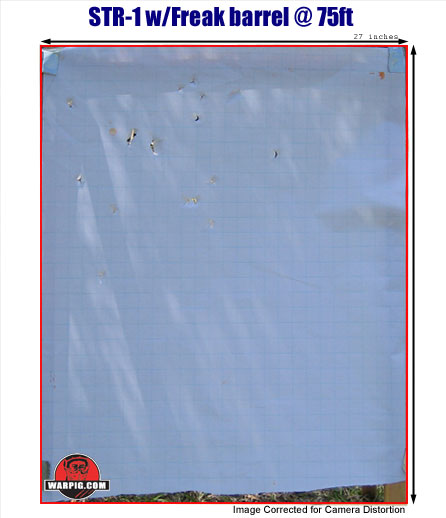
Understanding the Summary Data High: This represents the highest velocity in the recorded string of shots. Low: This represents the lowest velocity in the recorded string of shots. Extreme Spread: E.S. is the difference in velocity between the highest velocity shot and the lowest velocity shot. Average: This is the average velocity of the string of shots. This is the number to look at to compare whether velocity is increased overall, or decreased overall by a change in a variable. Standard Deviation: S.D. Is a mathematicall way of expressing how close most of the shots are to the average. The lower the Standard Deviation is, the more consistent the velocity is. 95%: This is an easier to understand way of expressing consistency. Statistically, there is a 95% chance than a given shot will vary this amount or less from the average. Target Groupings Target groupings were fired with the same setup, the test marker stand mounted, fired at a rate of approximately 1 ball per second under manual control, in two groups of 20 shots. Distance to the paper target was 75 feet, and the variable between the two groupings was the barrel - the marker's stock barrel compared to a Freak barrel with paint matched insert and All-American front. Photographs of the targets were then digitally adjusted to compensate for distortion produced by camera angle, so that they could be directly compared. The target comparison image on the testing page of this article is a composite of the two photographs, with colored highlights of the impact points to provide a direct visual comparison.
Thanks to Andrew Cannon and family for assistance in chrono and target testing.
|
| Copyright © 1992-2019
Corinthian Media Services. WARPIG's webmasters can be reached through our feedback form. All articles and images are copyrighted and may not be redistributed without the written permission of their original creators and Corinthian Media Services. The WARPIG paintball page is a collection of information and pointers to sources from around the internet and other locations. As such, Corinthian Media Services makes no claims to the trustworthiness or reliability of said information. The information contained in, and referenced by WARPIG, should not be used as a substitute for safety information from trained professionals in the paintball industry. |